What is Pacific Climate Futures v2.1?
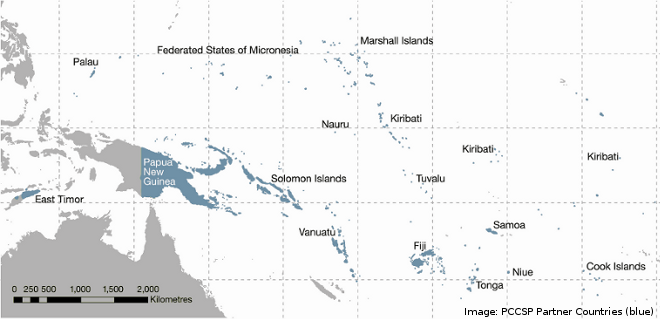
Pacific Climate Futures Version 2.1 is a free web-based climate impacts decision-support tool. Initially, the tool was developed by the Pacific Climate Change Science Program (PCCSP) and upgraded to version 2.0 by the Pacific-Australia Climate Change Science and Adaptation Planning (PACCSAP) Science Program. In 2017, a range of enhancements were incorporated into version 2.1 through additional Australian government funding. It provides national and some sub-national climate projections for East Timor and 14 Pacific countries: Cook Islands (two sub-regions), Federated States of Micronesia (two sub-regions), Fiji, Kiribati (three sub-regions), Marshall Islands (two sub-regions), Nauru, Niue, Palau, Papua New Guinea (two sub-regions), Samoa, Solomon Islands, Tonga, Tuvalu and Vanuatu.
Built on CSIRO’s Representative Climate Futures Framework (Clarke et al. 2011; Whetton et al. 2012), it includes projections from the global climate modelling experiments (CMIP5) that informed the IPCC’s Fifth Assessment Report as well as those used for the earlier Fourth Assessment Report (CMIP3). The CMIP3 results derive from up to 18 global climate models (GCMs), six of which were dynamically downscaled using a fine-resolution climate model called CCAM. These can be explored for three future time periods (2030, 2055 or 2090) and three emissions scenarios (low-B1, medium-A1B and high-A2). The CMIP5 results are from up to 43 GCMs, six of which were downscaled using CCAM. These projections can be explored for 13 time periods (2030, 2035, 2040...2085, 2090) and four new emissions scenarios (very-low-RCP2.6, low-RCP4.5, medium-RCP6.0 and very-high-RCP8.5).
The Pacific Climate Futures web-tool has been designed to provide information and guidance in the generation of national climate projections and facilitate the generation of data for detailed impact and risk assessments.
In version 2.1, a range of enhancements have been implemented including:
- Updated registrations system
- Removal of access restrictions
- Updates to the Projections Builder interface
- Addition of new and enhanced datasets
- Updated User Guide developed and published online
Full details of the enhancements are available in Section 1.1 of the User Guide.
Pacific Climate Futures has three levels of detail:
The basic interface provides a summary of the projected changes in annual temperature and rainfall and is accessible for everyone.
Intermediate level provides access to a guided interface to generate climate projections tailored to an impact assessment. Available to registerd users, the interface uses information entered by the user to recommend which models to use to represent the 'best', 'worst' and 'maximum consensus' cases.
Advanced level provides more flexibility to the user along with additional options for exporting data for use in risk assessments. Access is only available to registered users.
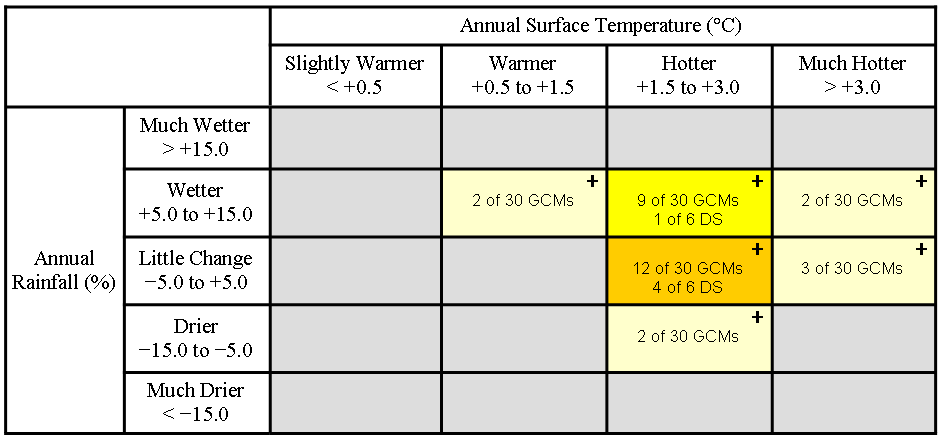
Projections are classified by the combined changes in two variables, with the data presented in an easy to understand colour-coded matrix (see below). The resultant classifications provide a clear visual display of the spread and clustering of the projections. This provides model consensus information for each classification and makes it easy for users to identify those that are of most importance to their impact assessment.
Users can then identify the ‘Best’ and ‘Worst’ cases in terms of likely impacts. It is also possible to identify a ‘Maximum Consensus’ case. For example, consider a study into the possible impacts of climate change on the incidence of mosquito-borne diseases. Using the example shown here, the worst case is likely to be the projection with the greatest increase in rainfall and temperature, i.e. ‘Much Hotter – Wetter’. The best case may be regarded as the ‘Hotter – Drier’ projection, while the maximum consensus projection is “Hotter – Little Change’. Thus users can apply the information from Pacific Climate Futures through a risk management approach to deal with the spread in the results (sometimes referred to as model uncertainty).

Example Climate Futures Matrix (GCM = global climate model; DS = downscale simulation)
Importantly, this tool is underpinned by the most extensive, independently peer reviewed climate model evaluation ever undertaken in the Pacific (Australian Bureau of Meteorology and CSIRO 2011; 2014). This research assessed and identified the most reliable and appropriate GCMs and downscaled (DS) simulations for the Pacific region, excluded models that do not perform well and identified those that should be used with caution in some countries. Where relevant, the Pacific Climate Futures tool brings this information to the attention of users who can select appropriate results at the click of a button.
A key feature of Pacific Climate Futures is the Representative Model Wizard. This identifies a suitable subset of models that can be used to represent the selected projections, e.g. one model to represent a ‘worst’ case, one to represent a ‘best’ case and one to represent the ‘maximum consensus’ case. This reduces the effort involved in data management and analysis.
For more information please refer to the User Guide.
Page updated: 24th September 2018
